
Scientific Industries Inc (OTC:SCND)
| Market Cap | $7.29M-4.5% |
| Revenue (ttm) | $5.68M-36.6% |
| Net Income | -$4.27M-245.0% |
| EPS | -$0.35-150.4% |
| Shares Out | 11.93M |
| PE Ratio | n/a |
| Forward PE | n/a |
| Dividend | n/a |
| Ex-Dividend Date | Nov 27, 2018 |
| Volume | 18,795 |
| Open | $0.75 |
| Previous Close | $0.61 |
| Day's Range | $0.50 - $0.75 |
| 52-Week Range | $0.30 - $0.88 |
| Beta | 0.28 |
| Analysts | Hold |
| Price Target | n/a |
| Earnings Date | Apr 5, 2027 |
About SCND
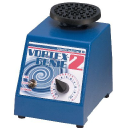
Scientific Industries, Inc. operates as a global enterprise specializing in the development, production, and distribution of a comprehensive range of benchtop laboratory instrumentation and advanced bioprocessing systems. Their product line features an assortment of mixers and shakers, prominently including vortex mixers designed to efficiently blend the contents of test tubes, beakers, and similar containers by utilizing a rotating cup or alternative attachments. This category further encompasses high-speed touch mixers, models with integrated timers, cell disruptors, microplate mixers, advanced vortex mixers equipped with digital controls and displays, multi-vessel vortex mixers, and orbital shakers. The company also supplies laboratories with benchtop multi-purpose rotators and rockers, facilitating the controlled movement of various vessels, alongside refrigerated incubators and incubated shakers optimized for temperature-sensitive mixing and agitation tasks. Their extensive selection of magnetic stirrers includes high/low programmable options, four-place high/low programmable units, large volume magnetic stirrers, and four-place general-purpose stirrers. Moreover, Scientific Industries delivers bioprocessing solutions that incorporate disposable sensors, such as coaster systems and other vessel-shaking apparatus. Beyond these, their offerings extend to precision instruments like mechanical balances, moisture analyzers, pill counters, test stands, force gauges, and digital scales tailored for pharmaceutical, laboratory, and industrial applications. These specialized tools are predominantly employed for research purposes across a diverse clientele, including academic institutions, pharmaceutical companies, pharmacies, national research facilities, medical device manufacturers, petrochemical enterprises, and various other industries engaged in laboratory-scale investigations. Scientific Industries markets its innovative solutions under the well-regarded Genie and Torbal brand names, reaching customers directly, through a network of laboratory equipment distributors, and via online channels. Established in 1954, Scientific Industries, Inc. maintains its corporate headquarters in Bohemia, New York.
Scientific Industries Inc Stock Analysis — InsiderScore
Scientific Industries Inc scored higher than 73% of companies evaluated by InsiderBuying, and ranked 12th out of 47 stocks in the healthcare sector.
Scores are percentile-ranked against every company we scored that day, with extra weight given to the size and conviction of each purchase and the seniority of the buyer.
Insiders at Scientific Industries Inc bought $57.8K of stock across 5 purchases in the last 90 days, the largest of them $33.3K.
The average purchase added about 2% to the buyer's existing holding. Doubling a stake earns full marks here; topping up an already large position earns very little.
Every buyer already held stock, so each purchase is an increase rather than a first position.
This category carries 35% of the Insider Score.
What Are Insiders Doing?
View the trades behind this meter — each links to its SEC Form 4 →
Open-market Form 4 purchases (code P) vs sales (code S) on file for this company. Grants, option exercises and tax withholdings are excluded. Informational only.
Next catalysts
- Apr 5, 2027Earnings report
$SCND stock is featured in our Insider Score Rankings, and Insider Trades datasets.
→ All Stock ListsRecently reported changes in SCND holdings by institutional investors
Latest 0 13F filings · Source: SEC EDGAR
View all institutional owners →Insider Trading
Quarterly net insider trading by SCND's directors and management
Source: SEC EDGAR (Form 4)
Corporate Lobbying
SCND Estimated quarterly lobbying spending
Source: U.S. Senate LDA
SCND Revenue by Segment
| Benchtop Laboratory Equipment | $1.06M | 58.03% |
| Loss From Operations | $470.00K | 25.76% |
| Bioprocessing Systems | $295.90K | 16.22% |
As of: Q3 2026 (Sep 30, 2026) · Source: SEC EDGAR (10-Q)
U.S. Patents
New SCND patent grants
Source: USPTO Open Data Portal
Government Contracts
Estimated quarterly amount awarded to SCND from public contracts
Source: USAspending.gov
Bull Case vs Bear Case
AI-generated from SCND’s recent data — informational, not investment advice
What’s Behind the Score
Recent Insider Activity
Insider Score Trend Over Time
+33.8 since Sep 24Composite Insider Score (0–100) recomputed on each scoring run from live SEC Form 4 data.